


Tracking Student Success with Niya Meet Analytics
Tracking Student Success with Niya Meet Analytics helps educators monitor attendance and engagement in real time, enabling early interventions, better insights, and improved learning outcomes.

Why Tracking Attendance and Engagement Matters

Attendance has always been a fundamental measure of student commitment and school participation. Research consistently shows that regular attendance correlates with higher academic achievement, stronger social development, and reduced dropout rates. However, attendance alone does not tell the full story. In virtual environments, students might log in but remain disengaged, turning attendance into a superficial metric.
This is where engagement analytics becomes transformative. Engagement goes beyond presence—it assesses how actively students participate in sessions, interact with learning materials, and contribute to collaborative activities. Effective tracking of both attendance and engagement enables educators to understand student behavior holistically, enabling timely interventions, targeted support, and personalized learning strategies.
Niya Meet: A Modern Lens into Student Participation
 Niya Meet integrates intuitive analytics tools directly into its platform, allowing educators to monitor attendance and engagement without switching between disparate systems. Through automated data collection and real-time dashboards, teachers gain a clearer, data-driven view of student activity throughout a lecture or virtual session.
Here’s how Niya Meet’s analytics empowers educational success:
1. Automated Attendance Tracking
 One of the fundamental features of Niya Meet is its automated attendance recording. As students join virtual sessions, the platform logs their presence—capturing metrics such as:
- Join and leave times.
- Session duration
- Late arrivals and early departures
2. Real-Time Engagement Indicators
 Attendance only reveals that a student is present. Niya Meet’s engagement analytics goes deeper, measuring signals that reflect student involvement, such as:
- Participant interactions (chat activity, polls, reactions)
- Frequency of contributions (responses, questions asked)
- Attention insights (based on activity patterns during the session)
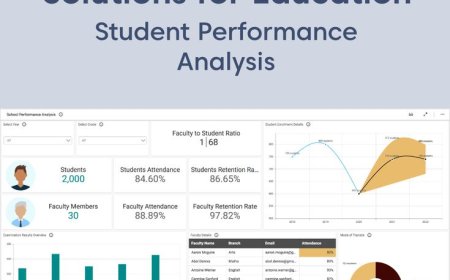
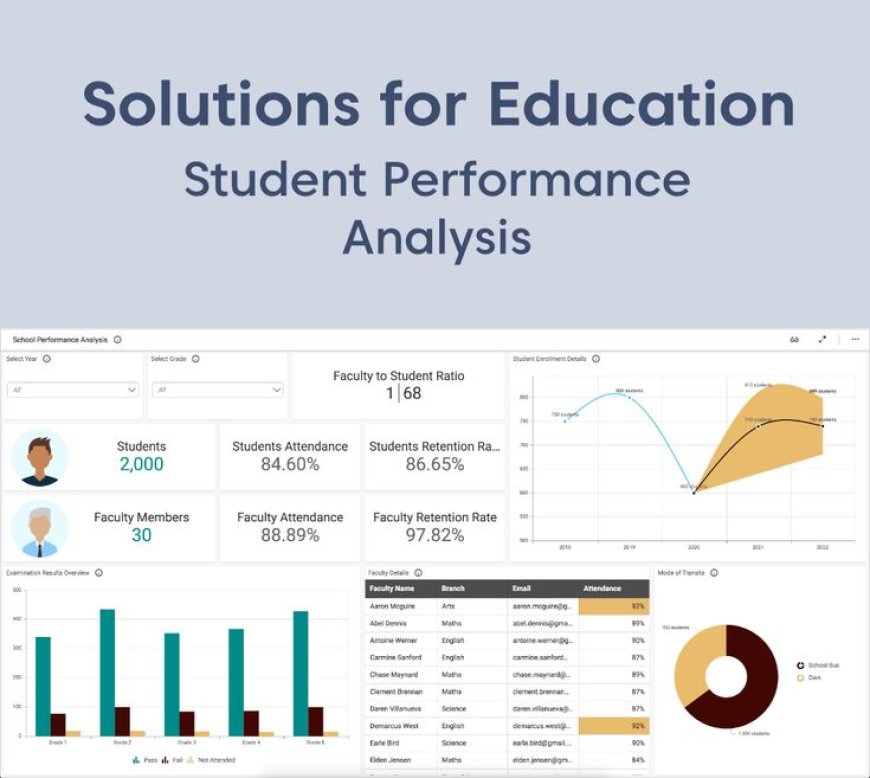
3. Personalized Dashboards
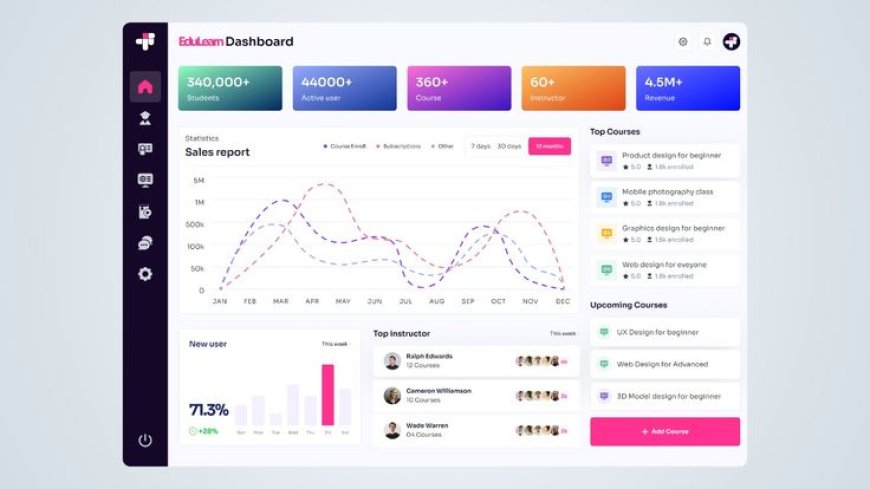 Niya Meet provides personalized dashboards for teachers and administrators. These dashboards visualize data with:
- Graphs showing engagement trends
- Heat maps highlighting peak participation times
- Student profiles summarizing individual attendance and engagement histories
Using Analytics for Interventions and Success
 Collected data is only powerful when acted upon. With Niya Meet’s analytics in hand, schools can design meaningful interventions tailored to individual needs:
Early Interventions
 Patterns of low engagement often signal broader learning challenges. By identifying these early through analytics, teachers and counselors can launch interventions such as:
- One-on-one mentoring
- Peer support
- Content review sessions
Parent and Guardian Communication
 Regular updates on attendance and engagement help build stronger connections between the school and families. Niya Meet’s reporting tools allow teachers to share insights with parents, offering transparency and inviting collaboration in supporting student progress.
Curriculum and Instructional Improvements
 At a class or institutional level, analytics can reveal which parts of the content are inspiring discussion and which sections see declining engagement. These insights enable teachers to adapt their pedagogy—adding interactive elements, adjusting pacing, or refining topics that consistently underperform.
Balancing Analytics and Human Insight
 While analytics provide objective data, they do not replace the human judgment of teachers. Instead, they enhance it. Educators bring context—understanding personal, emotional, or social factors that influence how a student performs. Niya Meet’s tools serve as a compass, pointing teachers toward areas that need attention, but human insight remains essential in interpreting and acting on that data.
Conclusion
What's Your Reaction?
 Like
0
Like
0
 Dislike
0
Dislike
0
 Love
0
Love
0
 Funny
0
Funny
0
 Angry
0
Angry
0
 Sad
0
Sad
0
 Wow
0
Wow
0